
Trade Decision Panel
Compare AI directional bias, GTO action, alignment, and review outcome.
AI Bias
SHORT
GTO Action
FLAT
Alignment
UNCLEAR
Outcome
N/A
Status
UNREVIEWED
Score
—
Horizon
—
Instrument
ES
Contract
ES 06-26
AI Bias
SHORT
GTO Action
FLAT
Alignment
UNCLEAR
Window Bars
48
Snapshot Metadata
Snapshot ID: 75569
Type: price_action
Instrument: ES
Contract: ES 06-26
GTO Action: 0
GTO Regime: ATM-FIRST
Window Start: Thursday, March 19, 2026 at 8:45:00 AM CDT
Window End: Thursday, March 19, 2026 at 12:50:00 PM CDT
Created: Thursday, March 19, 2026 at 12:51:40 PM CDT
Alignment: UNCLEAR
Tags: price-action, al-brooks, 5-minute
Notebook S3 Key: notebooks/brooks/ES_06-26_2026-03-19T12-50-00_id26054.ipynb
Chart
Click chart to enlarge
Context
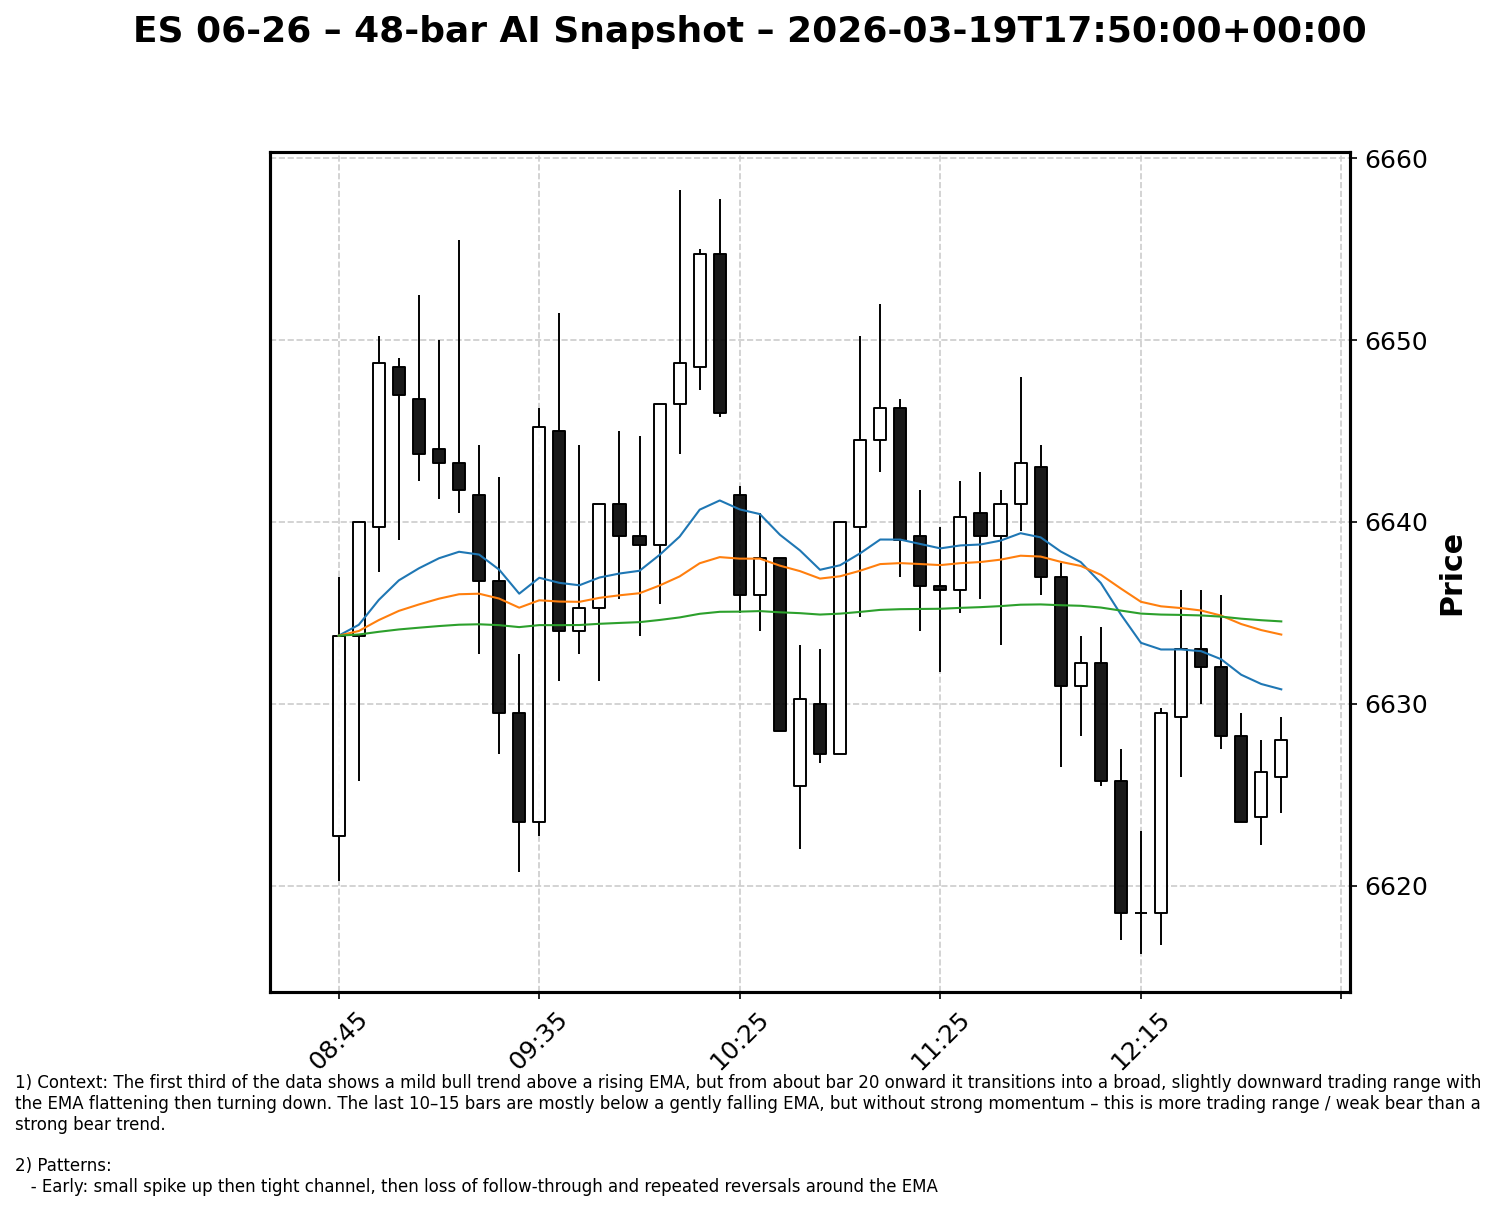
Context: The first third of the data shows a mild bull trend above a rising EMA, but from about bar 20 onward it transitions into a broad, slightly downward trading range with the EMA flattening then turning down. The last 10–15 bars are mostly below a gently falling EMA, but without strong momentum – this is more trading range / weak bear than a strong bear trend.
Patterns
Patterns:
- Early: small spike up then tight channel, then loss of follow-through and repeated reversals around the EMA (transition into TR).
- Multiple micro double tops/bottoms around 6638–6645 in the middle of the data = trading range behavior.
- Late: small bear leg down from ~6645 to ~6618 and then a pullback to the EMA (bars 41–44) – that’s a bear pullback to the EMA, followed by another leg down (bars 45–46), i.e., a small two-legged pullback in a weak bear.
- No clean, textbook wedge or strong spike & channel; this is mostly rangy price action.
Probability
Probability: Slight edge to the bears short term (price is below a falling EMA, and recent rallies are being sold), but overall this is trading-range price action, so both sides should expect frequent reversals and limited follow-through.
Entries / Avoidance
Entries / avoid:
- With-trend idea: Look to sell rallies toward/just above the EMA or prior minor resistance (e.g., 6632–6636 area) with stops above the most recent swing high, expecting a scalp down rather than a swing. Treat any test of 6640–6645 (if reached) as likely sell zone in this context.
- Avoid: Buying high near the EMA in the middle of the range, and avoid trading in the very tight, overlapping bars like 29–37 where there is no clear breakout – wait for a clear breakout with follow-through or a test of the range extremes before entering.