
AI Analysis
Latest published price action analysis from Machine A.
Instrument
ES
Contract
ES 12-26
AI Bias
LONG
GTO Action
N/A
Alignment
UNCLEAR
Window Bars
48
Snapshot Metadata
Snapshot ID: 86215
Type: price_action
Instrument: ES
Contract: ES 12-26
GTO Action: N/A
GTO Regime: N/A
Window Start: Wednesday, September 16, 2026 at 10:55:00 AM CDT
Window End: Wednesday, September 16, 2026 at 2:50:00 PM CDT
Created: Wednesday, September 16, 2026 at 2:51:38 PM CDT
Alignment: UNCLEAR
Tags: price-action, al-brooks, 5-minute
Notebook S3 Key: notebooks/brooks/ES_12-26_2026-09-16T14-50-00_id10079.ipynb
Chart
Click chart to enlarge
Context
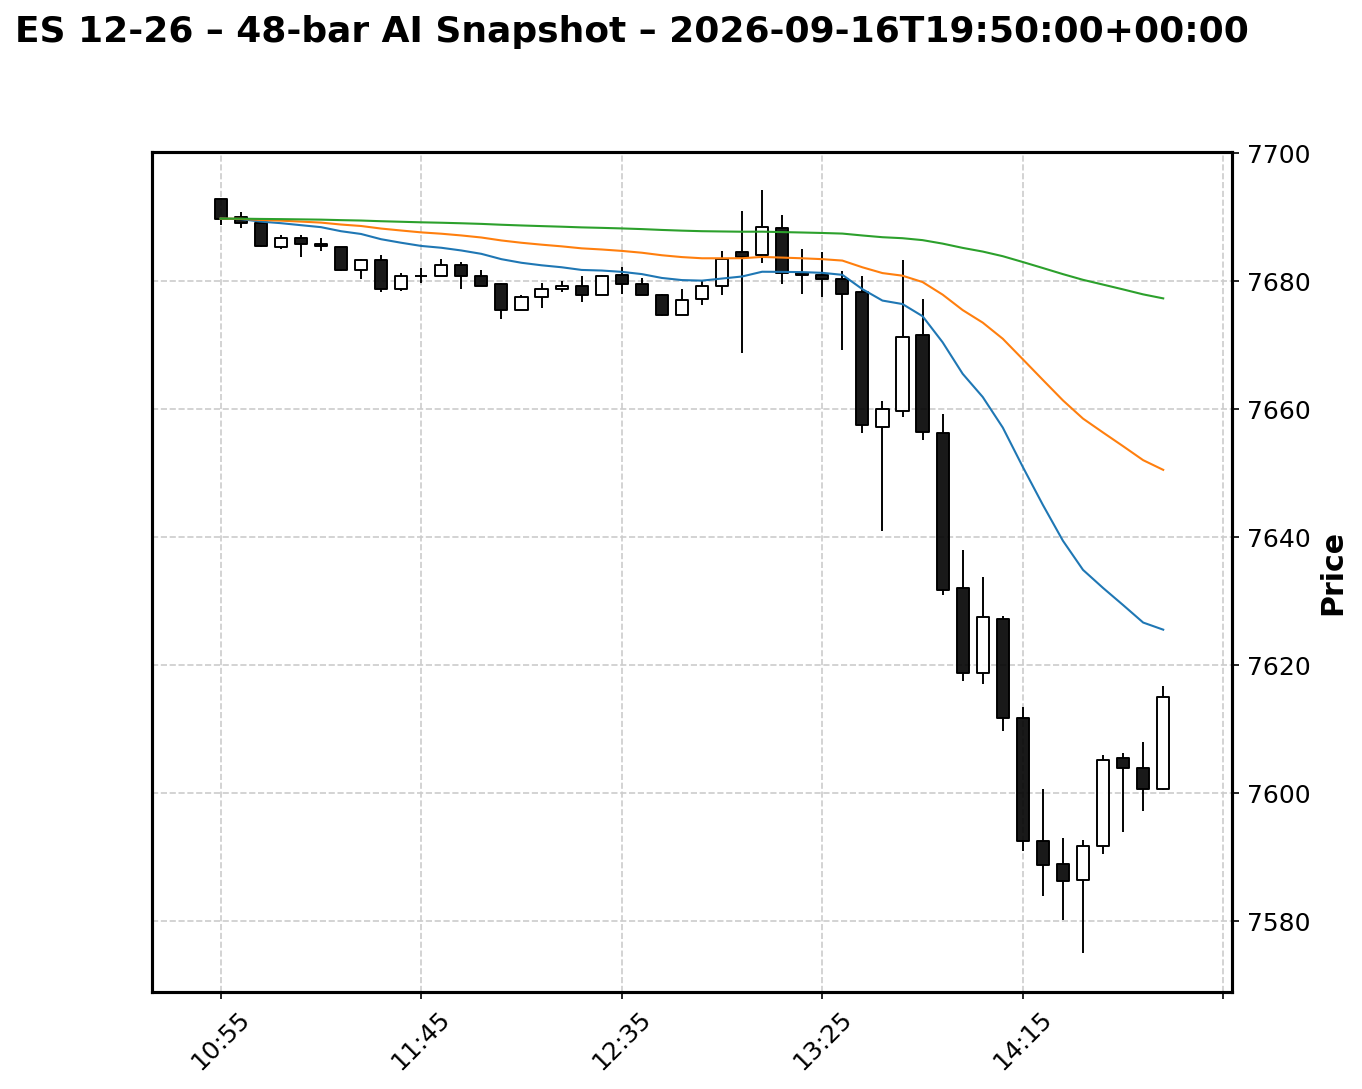
**Context:** Bars 26–42 are a **strong bear spike & channel / broad bear trend**: big bear breakout down from around the EMA and accelerating to new lows (32, 36–41), with the EMA turning down hard and price staying mostly below it. Bars 43–47 are a **sharp bounce (bull leg) inside the bear trend**, likely a pullback from oversold rather than a confirmed trend reversal yet.
Patterns
**Patterns (last 3 bars):** Bars **45–47** look like a **2–3 bar bull micro-channel** and a **small bull breakout** above the prior bar highs; bar 47 is a strong bull bar closing near its high. In Brooks terms, the last 3 bars are more “**bull follow-through in a pullback**” than clean textbook H1/H2; **bar 46 is effectively an H1 (first pullback) long attempt**, and **bar 47 is the follow-through / possible H2-style continuation** of that push up (but it’s still occurring below the EMA).
Probability
**Who has better odds now + breakout failure odds:** **Bears still have better probabilities overall** because the larger structure is a strong bear trend and price is still **well below a falling EMA** (rallies tend to be sold). The **current bull breakout failure probability: HIGH** because (i) the rally is occurring as a **pullback in a strong bear spike & channel**, (ii) it has not yet reclaimed/held above the EMA (still far below it), (iii) the bounce so far looks like a **sharp short-covering leg after a sell climax** (40–42 area) which commonly transitions into a trading range or fails on the next sell attempt, and (iv) there’s no multi-bar bull spike with consecutive large bull bodies breaking multiple resistance levels—just a late bounce from deeply oversold.
Entries / Avoidance
**Entries / avoid:** With-trend idea is to **wait for the pullback to stall** (near prior resistance like 7616–7633 or closer to the EMA) and look for a **bear reversal bar / lower high** to sell (typical “sell the first/second rally” in a bear). Avoid **buying high in the bounce** unless you’re scalping and willing to exit quickly—this is a common spot for a **bull breakout to fail** back into a developing trading range or into another leg down.